%pip install --upgrade -q jupysql psycopg2-binary python-dotenv sqlalchemySuperstore
Data Analysis
SQL
Overview
This project explores the superstore datasets using SQL to answer key analytical questions and uncover meaningful patterns in the data.
Queries are executed directly from a Jupyter Notebook using PostgreSQL, JupySQL, and SQLAlchemy.
Tools & Technologies
PostgreSQL
SQL
Jupyter Notebook
JupySQL
SQLAlchemy
Analysis Workflow
Preprocess the dataset and understand its structure.
Create the table schema and insert the data into the table.
Formulate analytical questions.
Query and manipulate data using SQL.
Interpret query results and summarize key findings.
Install Packages
%config SqlMagic.autopandas = True
%config SqlMagic.displaylimit = 50
Connect to The Database
import os
from dotenv import load_dotenv, find_dotenv

load_dotenv(find_dotenv())

# get credentials from .env
db_user = os.getenv("DB_USER")
db_password = os.getenv("DB_PASSWORD")
db_host = os.getenv("DB_HOST")
db_port = os.getenv("DB_PORT")
db_name = os.getenv("DB_NAME")

connection_string = f"postgresql://{db_user}:{db_password}@{db_host}:{db_port}/{db_name}"
os.environ['DATABASE_URL'] = connection_string%load_ext sql%sqlPrepare the Data
import pandas as pd

customers_df = pd.read_csv('data/customers.csv')
products_df = pd.read_csv('data/products.csv')
orders_df = pd.read_csv('data/orders.csv')customers_df| customer_id | customer_name | segment | country | city | state | postal_code | region | |
|---|---|---|---|---|---|---|---|---|
| 0 | CG-12520 | Claire Gute | Consumer | United States | Henderson | Kentucky | 42420 | South |
| 1 | DV-13045 | Darrin Van Huff | Corporate | United States | Los Angeles | California | 90036 | West |
| 2 | SO-20335 | Sean O'Donnell | Consumer | United States | Fort Lauderdale | Florida | 33311 | South |
| 3 | BH-11710 | Brosina Hoffman | Consumer | United States | Los Angeles | California | 90032 | West |
| 4 | AA-10480 | Andrew Allen | Consumer | United States | Concord | North Carolina | 28027 | South |
| ... | ... | ... | ... | ... | ... | ... | ... | ... |
| 788 | CJ-11875 | Carl Jackson | Corporate | United States | Philadelphia | Pennsylvania | 19140 | East |
| 789 | RS-19870 | Roy Skaria | Home Office | United States | Burlington | Iowa | 52601 | Central |
| 790 | SC-20845 | Sung Chung | Consumer | United States | Arlington Heights | Illinois | 60004 | Central |
| 791 | RE-19405 | Ricardo Emerson | Consumer | United States | Kent | Ohio | 44240 | East |
| 792 | SM-20905 | Susan MacKendrick | Consumer | United States | Newark | Ohio | 43055 | East |
793 rows × 8 columns
products_df| product_id | category | sub_category | product_name | |
|---|---|---|---|---|
| 0 | FUR-BO-10001798 | Furniture | Bookcases | Bush Somerset Collection Bookcase |
| 1 | FUR-CH-10000454 | Furniture | Chairs | Hon Deluxe Fabric Upholstered Stacking Chairs,... |
| 2 | OFF-LA-10000240 | Office Supplies | Labels | Self-Adhesive Address Labels for Typewriters b... |
| 3 | FUR-TA-10000577 | Furniture | Tables | Bretford CR4500 Series Slim Rectangular Table |
| 4 | OFF-ST-10000760 | Office Supplies | Storage | Eldon Fold 'N Roll Cart System |
| ... | ... | ... | ... | ... |
| 1857 | TEC-PH-10002817 | Technology | Phones | RCA ViSYS 25425RE1 Corded phone |
| 1858 | TEC-MA-10003589 | Technology | Machines | Cisco 8961 IP Phone Charcoal |
| 1859 | OFF-AP-10003099 | Office Supplies | Appliances | Eureka Hand Vacuum, Bagless |
| 1860 | TEC-PH-10002645 | Technology | Phones | LG G2 |
| 1861 | OFF-ST-10001627 | Office Supplies | Storage | Eldon Jumbo ProFile Portable File Boxes Graphi... |
1862 rows × 4 columns
orders_df| row_id | order_id | order_date | ship_date | ship_mode | customer_id | product_id | sales | quantity | discount | profit | |
|---|---|---|---|---|---|---|---|---|---|---|---|
| 0 | 1 | CA-2016-152156 | 2016-11-08 | 2016-11-11 | Second Class | CG-12520 | FUR-BO-10001798 | 261.9600 | 2 | 0.00 | 41.9136 |
| 1 | 2 | CA-2016-152156 | 2016-11-08 | 2016-11-11 | Second Class | CG-12520 | FUR-CH-10000454 | 731.9400 | 3 | 0.00 | 219.5820 |
| 2 | 3 | CA-2016-138688 | 2016-06-12 | 2016-06-16 | Second Class | DV-13045 | OFF-LA-10000240 | 14.6200 | 2 | 0.00 | 6.8714 |
| 3 | 4 | US-2015-108966 | 2015-10-11 | 2015-10-18 | Standard Class | SO-20335 | FUR-TA-10000577 | 957.5775 | 5 | 0.45 | -383.0310 |
| 4 | 5 | US-2015-108966 | 2015-10-11 | 2015-10-18 | Standard Class | SO-20335 | OFF-ST-10000760 | 22.3680 | 2 | 0.20 | 2.5164 |
| ... | ... | ... | ... | ... | ... | ... | ... | ... | ... | ... | ... |
| 9989 | 9990 | CA-2014-110422 | 2014-01-21 | 2014-01-23 | Second Class | TB-21400 | FUR-FU-10001889 | 25.2480 | 3 | 0.20 | 4.1028 |
| 9990 | 9991 | CA-2017-121258 | 2017-02-26 | 2017-03-03 | Standard Class | DB-13060 | FUR-FU-10000747 | 91.9600 | 2 | 0.00 | 15.6332 |
| 9991 | 9992 | CA-2017-121258 | 2017-02-26 | 2017-03-03 | Standard Class | DB-13060 | TEC-PH-10003645 | 258.5760 | 2 | 0.20 | 19.3932 |
| 9992 | 9993 | CA-2017-121258 | 2017-02-26 | 2017-03-03 | Standard Class | DB-13060 | OFF-PA-10004041 | 29.6000 | 4 | 0.00 | 13.3200 |
| 9993 | 9994 | CA-2017-119914 | 2017-05-04 | 2017-05-09 | Second Class | CC-12220 | OFF-AP-10002684 | 243.1600 | 2 | 0.00 | 72.9480 |
9994 rows × 11 columns
customers_df['country'].value_counts()country
United States 793
Name: count, dtype: int64orders_df['ship_mode'].value_counts()ship_mode
Standard Class 5968
Second Class 1945
First Class 1538
Same Day 543
Name: count, dtype: int64customers_df = customers_df.drop(columns=['country'])customers_df.info()<class 'pandas.DataFrame'>
RangeIndex: 793 entries, 0 to 792
Data columns (total 7 columns):
# Column Non-Null Count Dtype
--- ------ -------------- -----
0 customer_id 793 non-null str
1 customer_name 793 non-null str
2 segment 793 non-null str
3 city 793 non-null str
4 state 793 non-null str
5 postal_code 793 non-null int64
6 region 793 non-null str
dtypes: int64(1), str(6)
memory usage: 43.5 KBproducts_df.info()<class 'pandas.DataFrame'>
RangeIndex: 1862 entries, 0 to 1861
Data columns (total 4 columns):
# Column Non-Null Count Dtype
--- ------ -------------- -----
0 product_id 1862 non-null str
1 category 1862 non-null str
2 sub_category 1862 non-null str
3 product_name 1862 non-null str
dtypes: str(4)
memory usage: 58.3 KBorders_df.info()<class 'pandas.DataFrame'>
RangeIndex: 9994 entries, 0 to 9993
Data columns (total 11 columns):
# Column Non-Null Count Dtype
--- ------ -------------- -----
0 row_id 9994 non-null int64
1 order_id 9994 non-null str
2 order_date 9994 non-null str
3 ship_date 9994 non-null str
4 ship_mode 9994 non-null str
5 customer_id 9994 non-null str
6 product_id 9994 non-null str
7 sales 9994 non-null float64
8 quantity 9994 non-null int64
9 discount 9994 non-null float64
10 profit 9994 non-null float64
dtypes: float64(3), int64(2), str(6)
memory usage: 859.0 KBCreate the Table Schema
%%sql
-- customers table
CREATE TABLE IF NOT EXISTS customers (
    customer_id VARCHAR(15) PRIMARY KEY,
    customer_name VARCHAR(100) NOT NULL,
    segment VARCHAR(25),
    city VARCHAR(50),
    state VARCHAR(50),
    postal_code VARCHAR(10),
    region VARCHAR(15)
);

-- products table
CREATE TABLE IF NOT EXISTS products (
    product_id VARCHAR(25) PRIMARY KEY,
    category VARCHAR(50),
    sub_category VARCHAR(50),
    product_name TEXT
);

-- orders table
CREATE TABLE IF NOT EXISTS orders (
    row_id INT PRIMARY KEY,
    order_id VARCHAR(25) NOT NULL,
    order_date DATE NOT NULL,
    ship_date DATE,
    ship_mode VARCHAR(25),
    customer_id VARCHAR(15) REFERENCES customers(customer_id),
    product_id VARCHAR(25) REFERENCES products(product_id),
    sales NUMERIC(10, 4),
    quantity INT,
    discount NUMERIC(4, 2),
    profit NUMERIC(10, 4)
);
Running query in 'postgresql://postgres:***@localhost:5432/sql_projects_db'
Insert The Data Into The Table
def insert_new_data(df, table_name, engine, key_cols):
    '''Insert only new data from DataFrame to the table in the SQL database.

    :param df: pandas DataFrame.
    :param table_name: a string of table name destination in the SQL database.
    :param engine: SQLAlchemy engine connection object.
    :param key_cols: string or list of primary key/composite keys
    '''

    if df.empty:
        print("DataFrame is empty.")
        return

    # make the key_cols is always a list
    if isinstance(key_cols, str):
        keys = [key_cols]
    else:
        keys = key_cols

    cols_str = ", ".join(keys)
    query = f"SELECT {cols_str} FROM {table_name}"
    existing_df = pd.read_sql(query, con=engine)


    if len(keys) == 1:
        # only 1 primary key
        key_col = keys[0]
        existing_keys = existing_df[key_col].tolist()
        new_df = df[~df[key_col].isin(existing_keys)].copy()
    else:
        # composite key
        merged = df.merge(existing_df[keys].drop_duplicates(), on=keys, how="left", indicator=True)
        new_df = merged[merged["_merge"] == "left_only"].drop(columns=["_merge"]).copy()

    if not new_df.empty:
        new_df.to_sql(table_name, con=engine, if_exists="append", index=False)
        print(f"Successfully inserted {len(new_df)} new rows of data into the table '{table_name}'.")
    else:
        print(f"All datas have been saved to the table '{table_name}'.")
from sqlalchemy import create_engine
engine = create_engine(connection_string)
# insert customers data
insert_new_data(df=customers_df, table_name='customers', engine=engine, key_cols='customer_id')
# insert products data
insert_new_data(df=products_df, table_name='products', engine=engine, key_cols='product_id')
# insert orders data
insert_new_data(df=orders_df, table_name='orders', engine=engine, key_cols='row_id')All datas have been saved to the table 'customers'.
Successfully inserted 1862 new rows of data into the table 'products'.
Successfully inserted 9994 new rows of data into the table 'orders'.%%sql
SELECT *
FROM customers
LIMIT 5;
Running query in 'postgresql://postgres:***@localhost:5432/sql_projects_db'
5 rows affected.
| customer_id | customer_name | segment | city | state | postal_code | region | |
|---|---|---|---|---|---|---|---|
| 0 | CG-12520 | Claire Gute | Consumer | Henderson | Kentucky | 42420 | South |
| 1 | DV-13045 | Darrin Van Huff | Corporate | Los Angeles | California | 90036 | West |
| 2 | SO-20335 | Sean O'Donnell | Consumer | Fort Lauderdale | Florida | 33311 | South |
| 3 | BH-11710 | Brosina Hoffman | Consumer | Los Angeles | California | 90032 | West |
| 4 | AA-10480 | Andrew Allen | Consumer | Concord | North Carolina | 28027 | South |
%%sql
SELECT *
FROM products
LIMIT 5;
Running query in 'postgresql://postgres:***@localhost:5432/sql_projects_db'
5 rows affected.
| product_id | category | sub_category | product_name | |
|---|---|---|---|---|
| 0 | FUR-BO-10001798 | Furniture | Bookcases | Bush Somerset Collection Bookcase |
| 1 | FUR-CH-10000454 | Furniture | Chairs | Hon Deluxe Fabric Upholstered Stacking Chairs,... |
| 2 | OFF-LA-10000240 | Office Supplies | Labels | Self-Adhesive Address Labels for Typewriters b... |
| 3 | FUR-TA-10000577 | Furniture | Tables | Bretford CR4500 Series Slim Rectangular Table |
| 4 | OFF-ST-10000760 | Office Supplies | Storage | Eldon Fold 'N Roll Cart System |
%%sql
SELECT *
FROM orders
LIMIT 5;
Running query in 'postgresql://postgres:***@localhost:5432/sql_projects_db'
5 rows affected.
| row_id | order_id | order_date | ship_date | ship_mode | customer_id | product_id | sales | quantity | discount | profit | |
|---|---|---|---|---|---|---|---|---|---|---|---|
| 0 | 1 | CA-2016-152156 | 2016-11-08 | 2016-11-11 | Second Class | CG-12520 | FUR-BO-10001798 | 261.9600 | 2 | 0.00 | 41.9136 |
| 1 | 2 | CA-2016-152156 | 2016-11-08 | 2016-11-11 | Second Class | CG-12520 | FUR-CH-10000454 | 731.9400 | 3 | 0.00 | 219.5820 |
| 2 | 3 | CA-2016-138688 | 2016-06-12 | 2016-06-16 | Second Class | DV-13045 | OFF-LA-10000240 | 14.6200 | 2 | 0.00 | 6.8714 |
| 3 | 4 | US-2015-108966 | 2015-10-11 | 2015-10-18 | Standard Class | SO-20335 | FUR-TA-10000577 | 957.5775 | 5 | 0.45 | -383.0310 |
| 4 | 5 | US-2015-108966 | 2015-10-11 | 2015-10-18 | Standard Class | SO-20335 | OFF-ST-10000760 | 22.3680 | 2 | 0.20 | 2.5164 |
Business Questions
Question 1
How have sales and profitability evolved over time?
%%sql
WITH monthly_sales_profit AS (
    SELECT
        DATE_TRUNC('month', order_date)::date AS month,
        SUM(sales) AS total_sales,
        SUM(profit) AS total_profit
    FROM orders
    GROUP BY DATE_TRUNC('month', order_date)::date
),
sales_profit_trends AS (
    SELECT
        month,
        total_sales,
        total_profit,
        LAG(total_sales) OVER (ORDER BY month) AS previous_month_sales,
        LAG(total_profit) OVER (ORDER BY month) AS previous_month_profit
    FROM monthly_sales_profit
)
SELECT
    month,
    total_sales,
    total_profit,
    previous_month_sales,
    previous_month_profit,
    ROUND(
        100.0 * (total_sales - previous_month_sales) / NULLIF(previous_month_sales, 0),
        2
    ) AS growth_sales_pct,
    ROUND(
        100.0 * (total_profit - previous_month_profit) / NULLIF(previous_month_profit, 0),
        2
    ) AS growth_profit_pct
FROM sales_profit_trends
ORDER BY month
Running query in 'postgresql://postgres:***@localhost:5432/sql_projects_db'
48 rows affected.
| month | total_sales | total_profit | previous_month_sales | previous_month_profit | growth_sales_pct | growth_profit_pct | |
|---|---|---|---|---|---|---|---|
| 0 | 2014-01-01 | 14236.8950 | 2450.1907 | None | None | None | None |
| 1 | 2014-02-01 | 4519.8920 | 862.3084 | 14236.8950 | 2450.1907 | -68.25 | -64.81 |
| 2 | 2014-03-01 | 55691.0090 | 498.7299 | 4519.8920 | 862.3084 | 1132.13 | -42.16 |
| 3 | 2014-04-01 | 28295.3450 | 3488.8352 | 55691.0090 | 498.7299 | -49.19 | 599.54 |
| 4 | 2014-05-01 | 23648.2870 | 2738.7096 | 28295.3450 | 3488.8352 | -16.42 | -21.50 |
| 5 | 2014-06-01 | 34595.1276 | 4976.5244 | 23648.2870 | 2738.7096 | 46.29 | 81.71 |
| 6 | 2014-07-01 | 33946.3930 | -841.4826 | 34595.1276 | 4976.5244 | -1.88 | -116.91 |
| 7 | 2014-08-01 | 27909.4685 | 5318.1050 | 33946.3930 | -841.4826 | -17.78 | -731.99 |
| 8 | 2014-09-01 | 81777.3508 | 8328.0994 | 27909.4685 | 5318.1050 | 193.01 | 56.60 |
| 9 | 2014-10-01 | 31453.3930 | 3448.2573 | 81777.3508 | 8328.0994 | -61.54 | -58.59 |
| 10 | 2014-11-01 | 78628.7167 | 9292.1269 | 31453.3930 | 3448.2573 | 149.98 | 169.47 |
| 11 | 2014-12-01 | 69545.6205 | 8983.5699 | 78628.7167 | 9292.1269 | -11.55 | -3.32 |
| 12 | 2015-01-01 | 18174.0756 | -3281.0070 | 69545.6205 | 8983.5699 | -73.87 | -136.52 |
| 13 | 2015-02-01 | 11951.4110 | 2813.8508 | 18174.0756 | -3281.0070 | -34.24 | -185.76 |
| 14 | 2015-03-01 | 38726.2520 | 9732.0978 | 11951.4110 | 2813.8508 | 224.03 | 245.86 |
| 15 | 2015-04-01 | 34195.2085 | 4187.4962 | 38726.2520 | 9732.0978 | -11.70 | -56.97 |
| 16 | 2015-05-01 | 30131.6865 | 4667.8690 | 34195.2085 | 4187.4962 | -11.88 | 11.47 |
| 17 | 2015-06-01 | 24797.2920 | 3335.5572 | 30131.6865 | 4667.8690 | -17.70 | -28.54 |
| 18 | 2015-07-01 | 28765.3250 | 3288.6483 | 24797.2920 | 3335.5572 | 16.00 | -1.41 |
| 19 | 2015-08-01 | 36898.3322 | 5355.8084 | 28765.3250 | 3288.6483 | 28.27 | 62.86 |
| 20 | 2015-09-01 | 64595.9180 | 8209.1627 | 36898.3322 | 5355.8084 | 75.06 | 53.28 |
| 21 | 2015-10-01 | 31404.9235 | 2817.3660 | 64595.9180 | 8209.1627 | -51.38 | -65.68 |
| 22 | 2015-11-01 | 75972.5635 | 12474.7884 | 31404.9235 | 2817.3660 | 141.91 | 342.78 |
| 23 | 2015-12-01 | 74919.5212 | 8016.9659 | 75972.5635 | 12474.7884 | -1.39 | -35.73 |
| 24 | 2016-01-01 | 18542.4910 | 2824.8233 | 74919.5212 | 8016.9659 | -75.25 | -64.76 |
| 25 | 2016-02-01 | 22978.8150 | 5004.5795 | 18542.4910 | 2824.8233 | 23.93 | 77.16 |
| 26 | 2016-03-01 | 51715.8750 | 3611.9680 | 22978.8150 | 5004.5795 | 125.06 | -27.83 |
| 27 | 2016-04-01 | 38750.0390 | 2977.8149 | 51715.8750 | 3611.9680 | -25.07 | -17.56 |
| 28 | 2016-05-01 | 56987.7280 | 8662.1464 | 38750.0390 | 2977.8149 | 47.06 | 190.89 |
| 29 | 2016-06-01 | 40344.5340 | 4750.3781 | 56987.7280 | 8662.1464 | -29.20 | -45.16 |
| 30 | 2016-07-01 | 39261.9630 | 4432.8779 | 40344.5340 | 4750.3781 | -2.68 | -6.68 |
| 31 | 2016-08-01 | 31115.3743 | 2062.0693 | 39261.9630 | 4432.8779 | -20.75 | -53.48 |
| 32 | 2016-09-01 | 73410.0249 | 9328.6576 | 31115.3743 | 2062.0693 | 135.93 | 352.39 |
| 33 | 2016-10-01 | 59687.7450 | 16243.1425 | 73410.0249 | 9328.6576 | -18.69 | 74.12 |
| 34 | 2016-11-01 | 79411.9658 | 4011.4075 | 59687.7450 | 16243.1425 | 33.05 | -75.30 |
| 35 | 2016-12-01 | 96999.0430 | 17885.3093 | 79411.9658 | 4011.4075 | 22.15 | 345.86 |
| 36 | 2017-01-01 | 43971.3740 | 7140.4391 | 96999.0430 | 17885.3093 | -54.67 | -60.08 |
| 37 | 2017-02-01 | 20301.1334 | 1613.8720 | 43971.3740 | 7140.4391 | -53.83 | -77.40 |
| 38 | 2017-03-01 | 58872.3528 | 14751.8915 | 20301.1334 | 1613.8720 | 190.00 | 814.07 |
| 39 | 2017-04-01 | 36521.5361 | 933.2900 | 58872.3528 | 14751.8915 | -37.96 | -93.67 |
| 40 | 2017-05-01 | 44261.1102 | 6342.5828 | 36521.5361 | 933.2900 | 21.19 | 579.59 |
| 41 | 2017-06-01 | 52981.7257 | 8223.3357 | 44261.1102 | 6342.5828 | 19.70 | 29.65 |
| 42 | 2017-07-01 | 45264.4160 | 6952.6212 | 52981.7257 | 8223.3357 | -14.57 | -15.45 |
| 43 | 2017-08-01 | 63120.8880 | 9040.9557 | 45264.4160 | 6952.6212 | 39.45 | 30.04 |
| 44 | 2017-09-01 | 87866.6520 | 10991.5556 | 63120.8880 | 9040.9557 | 39.20 | 21.58 |
| 45 | 2017-10-01 | 77776.9232 | 9275.2755 | 87866.6520 | 10991.5556 | -11.48 | -15.61 |
| 46 | 2017-11-01 | 118447.8250 | 9690.1037 | 77776.9232 | 9275.2755 | 52.29 | 4.47 |
| 47 | 2017-12-01 | 83829.3188 | 8483.3468 | 118447.8250 | 9690.1037 | -29.23 | -12.45 |
%%sql sales_profit_trends <<
WITH monthly_sales_profit AS (
    SELECT
        DATE_TRUNC('month', order_date)::date AS month,
        SUM(sales) AS total_sales,
        SUM(profit) AS total_profit
    FROM orders
    GROUP BY DATE_TRUNC('month', order_date)::date
),
sales_profit_trends AS (
    SELECT
        month,
        total_sales,
        total_profit,
        LAG(total_sales) OVER (ORDER BY month) AS previous_month_sales,
        LAG(total_profit) OVER (ORDER BY month) AS previous_month_profit
    FROM monthly_sales_profit
)
SELECT
    month,
    total_sales,
    total_profit,
    previous_month_sales,
    previous_month_profit,
    ROUND(
        100.0 * (total_sales - previous_month_sales) / NULLIF(previous_month_sales, 0),
        2
    ) AS growth_sales_pct,
    ROUND(
        100.0 * (total_profit - previous_month_profit) / NULLIF(previous_month_profit, 0),
        2
    ) AS growth_profit_pct
FROM sales_profit_trends
ORDER BY month
Running query in 'postgresql://postgres:***@localhost:5432/sql_projects_db'
48 rows affected.
import matplotlib.pyplot as plt

plt.figure(figsize=(10,5))
plt.plot(sales_profit_trends['month'], sales_profit_trends['total_sales'], color='blue')
plt.plot(sales_profit_trends['month'], sales_profit_trends['total_profit'], color='green')
plt.title('Monthly Sales and Profit Over Time')
plt.xlabel('Month')
plt.ylabel('Amount')
plt.legend(['Total Sales', 'Total Profit'])
plt.show()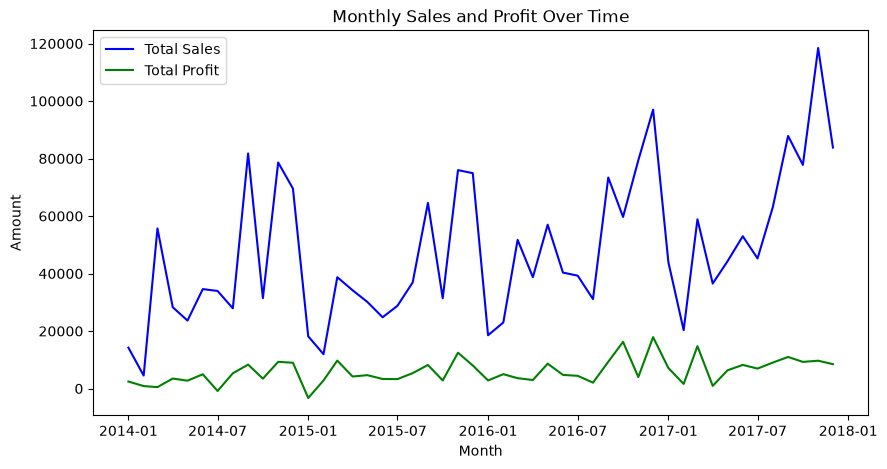
Monthly sales fluctuate considerably throughout the observed period, from January 2014 to December 2017, with seasonal peak pattern toward the end of the period, reaching their highest level in late 2017 at approximately 118,000. Monthly profit generally follows a similar pattern, although its fluctuations are less pronounced in absolute terms. Several months show relatively low or negative profits despite positive sales, indicating that higher sales do not always translate into higher profitability.
Question 2
Which product categories and subcategories generate the highest sales and profit?
%%sql
SELECT
    p.category,
    p.sub_category,
    SUM(o.sales) AS total_sales,
    SUM(o.profit) AS total_profit,
    ROUND(
        100.0 * SUM(o.profit) / NULLIF(SUM(o.sales), 0),
        2
    ) AS profit_margin_pct
FROM orders AS o
LEFT JOIN products AS p
    ON o.product_id = p.product_id
GROUP BY p.category, p.sub_category
ORDER BY total_sales DESC;
Running query in 'postgresql://postgres:***@localhost:5432/sql_projects_db'
17 rows affected.
| category | sub_category | total_sales | total_profit | profit_margin_pct | |
|---|---|---|---|---|---|
| 0 | Technology | Phones | 330007.0540 | 44515.7306 | 13.49 |
| 1 | Furniture | Chairs | 328449.1030 | 26590.1663 | 8.10 |
| 2 | Office Supplies | Storage | 223843.6080 | 21278.8264 | 9.51 |
| 3 | Furniture | Tables | 206965.5320 | -17725.4811 | -8.56 |
| 4 | Office Supplies | Binders | 203412.7330 | 30221.7633 | 14.86 |
| 5 | Technology | Machines | 189238.6310 | 3384.7569 | 1.79 |
| 6 | Technology | Accessories | 167380.3180 | 41936.6357 | 25.05 |
| 7 | Technology | Copiers | 149528.0300 | 55617.8249 | 37.20 |
| 8 | Furniture | Bookcases | 114879.9963 | -3472.5560 | -3.02 |
| 9 | Office Supplies | Appliances | 107532.1610 | 18138.0054 | 16.87 |
| 10 | Furniture | Furnishings | 91705.1640 | 13059.1436 | 14.24 |
| 11 | Office Supplies | Paper | 78479.2060 | 34053.5693 | 43.39 |
| 12 | Office Supplies | Supplies | 46673.5380 | -1189.0995 | -2.55 |
| 13 | Office Supplies | Art | 27118.7920 | 6527.7870 | 24.07 |
| 14 | Office Supplies | Envelopes | 16476.4020 | 6964.1767 | 42.27 |
| 15 | Office Supplies | Labels | 12486.3120 | 5546.2540 | 44.42 |
| 16 | Office Supplies | Fasteners | 3024.2800 | 949.5182 | 31.40 |
Technology products demonstrate strong profitability, particularly Copiers, which generate approximately 55,618 in profit with a profit margin of 37.20%. Phones also contribute substantial profit, totaling approximately 44,516. Within Office Supplies, Paper achieves a relatively high profit margin of 43.39%, while Binders generates approximately 30,222 in profit.
However, profitability varies considerably across product sub-categories. Tables generate approximately 206,965 in sales but incur a loss of around 17,725, resulting in a negative profit margin of 8.56%. Bookcases and Supplies also generate negative profits, suggesting that high sales alone are not sufficient indicators of strong product performance.
Question 3
How does discounting relate to profitability?
%%sql
WITH categorized_orders AS (
    SELECT
        CASE
            WHEN discount = 0 THEN 'No discount'
            WHEN discount <= 0.20 THEN 'Low discount (0% < x <= 20%)'
            WHEN discount <= 0.50 THEN 'Medium discount (20% < x <= 50%)'
            ELSE 'High discount (>50%)'
        END AS discount_group,
        sales,
        profit
    FROM orders
)
SELECT
    discount_group,
    SUM(sales) AS total_sales,
    SUM(profit) AS total_profit,
    ROUND(
        100.0 * SUM(profit) / NULLIF(SUM(sales), 0),
        2
    ) AS profit_margin_pct
FROM categorized_orders
GROUP BY discount_group
ORDER BY MIN(
    CASE discount_group
        WHEN 'No discount' THEN 1
        WHEN 'Low discount (0% < x <= 20%)' THEN 2
        WHEN 'Medium discount (20% < x <= 50%)' THEN 3
        ELSE 4
    END
);
Running query in 'postgresql://postgres:***@localhost:5432/sql_projects_db'
4 rows affected.
| discount_group | total_sales | total_profit | profit_margin_pct | |
|---|---|---|---|---|
| 0 | No discount | 1087908.4700 | 320987.6032 | 29.51 |
| 1 | Low discount (0% < x <= 20%) | 846522.2405 | 100785.4745 | 11.91 |
| 2 | Medium discount (20% < x <= 50%) | 298541.4118 | -58817.0047 | -19.70 |
| 3 | High discount (>50%) | 64228.7380 | -76559.0513 | -119.20 |
The results show a clear association between higher discount levels and lower profitability. Orders without discounts generate approximately 320,988 in profit, with a profit margin of 29.51%. Orders with low discounts have a positive profit margin of 11.91%, while medium-discount orders produce a negative margin of 19.70%. High-discount orders perform worst, recording a negative profit margin of 119.20%.
These findings suggest that substantial discounts may erode profit margins and lead to losses. However, this analysis shows an association rather than proving that discounts alone cause lower profitability, since product mix and other factors may also influence the results.
Question 4
Which customer segments contribute the most to sales and profit?
%%sql
SELECT
    c.segment,
    COUNT(DISTINCT c.customer_id) AS total_customers,
    COUNT(DISTINCT o.order_id) AS total_orders,
    SUM(o.sales) AS total_sales,
    SUM(o.profit) AS total_profit,
    ROUND(
        SUM(o.sales)
        / NULLIF(COUNT(DISTINCT o.order_id), 0),
        2
    ) AS sales_per_order
FROM orders AS o
LEFT JOIN customers AS c
    ON o.customer_id = c.customer_id
GROUP BY c.segment
ORDER BY total_sales DESC;
Running query in 'postgresql://postgres:***@localhost:5432/sql_projects_db'
3 rows affected.
| segment | total_customers | total_orders | total_sales | total_profit | sales_per_order | |
|---|---|---|---|---|---|---|
| 0 | Consumer | 409 | 2586 | 1161401.3450 | 134119.2092 | 449.11 |
| 1 | Corporate | 236 | 1514 | 706146.3668 | 91979.1340 | 466.41 |
| 2 | Home Office | 148 | 909 | 429653.1485 | 60298.6785 | 472.67 |
The Consumer segment contributes the largest total sales, approximately 1.16 million, and the highest total profit, approximately 134,119. It also accounts for 2,586 orders from 409 customers. The Corporate segment generates approximately 706,146 in sales and 91,979 in profit, while Home Office generates approximately 429,653 in sales and 60,299 in profit.
Although Consumer contributes the largest overall revenue and profit, Home Office records the highest average sales per order at approximately 472.67, followed by Corporate at 466.41 and Consumer at 449.11. This indicates that Home Office orders have a slightly higher average transaction value despite the segment’s smaller overall scale.
Question 5
Which regions and states perform best in terms of sales and profitability?
%%sql
SELECT
    c.region,
    c.state,
    SUM(o.sales) AS total_sales,
    SUM(o.profit) AS total_profit,
    ROUND(
        100.0 * SUM(o.profit)
        / NULLIF(SUM(o.sales), 0),
        2
    ) AS profit_margin_pct
FROM orders AS o
LEFT JOIN customers AS c
    ON o.customer_id = c.customer_id
GROUP BY
    c.region,
    c.state
ORDER BY total_sales DESC;
Running query in 'postgresql://postgres:***@localhost:5432/sql_projects_db'
41 rows affected.
| region | state | total_sales | total_profit | profit_margin_pct | |
|---|---|---|---|---|---|
| 0 | West | California | 451036.5823 | 59398.3125 | 13.17 |
| 1 | East | New York | 279549.8235 | 58177.8341 | 20.81 |
| 2 | Central | Texas | 192758.2049 | 20528.9110 | 10.65 |
| 3 | East | Pennsylvania | 142838.5510 | 13604.9350 | 9.52 |
| 4 | West | Washington | 133177.2518 | 24405.7966 | 18.33 |
| 5 | South | North Carolina | 116635.4615 | -4236.6732 | -3.63 |
| 6 | Central | Illinois | 112819.7720 | 9560.1456 | 8.47 |
| 7 | West | Arizona | 81986.1230 | 9563.2001 | 11.66 |
| 8 | East | Ohio | 74771.3300 | 5985.8870 | 8.01 |
| 9 | Central | Michigan | 58076.8598 | 7752.2969 | 13.35 |
| 10 | West | Colorado | 57523.1162 | 970.4647 | 1.69 |
| 11 | South | Georgia | 51400.1450 | 12781.3426 | 24.87 |
| 12 | Central | Minnesota | 50062.3805 | 7202.5225 | 14.39 |
| 13 | South | Florida | 50002.9898 | 750.7424 | 1.50 |
| 14 | South | Virginia | 46521.2980 | 6940.1112 | 14.92 |
| 15 | Central | Wisconsin | 40970.2510 | 8569.8697 | 20.92 |
| 16 | South | Tennessee | 36733.5832 | 3434.2765 | 9.35 |
| 17 | South | Alabama | 31038.9918 | 2845.0624 | 9.17 |
| 18 | South | Kentucky | 29143.8450 | 4513.3140 | 15.49 |
| 19 | East | Massachusetts | 28411.3450 | 5905.5446 | 20.79 |
| 20 | Central | Indiana | 22977.8640 | 2707.3495 | 11.78 |
| 21 | East | Delaware | 21056.0850 | 3336.3827 | 15.85 |
| 22 | East | New Jersey | 20267.0680 | 2336.7532 | 11.53 |
| 23 | South | Mississippi | 19347.2450 | 550.6659 | 2.85 |
| 24 | East | Connecticut | 18549.8010 | 533.4987 | 2.88 |
| 25 | West | Oregon | 17327.1710 | 234.0495 | 1.35 |
| 26 | South | Louisiana | 16625.8680 | 2659.2401 | 15.99 |
| 27 | West | Utah | 16323.0270 | 1818.1938 | 11.14 |
| 28 | Central | Missouri | 13013.1750 | 2212.8747 | 17.00 |
| 29 | East | Rhode Island | 12782.8900 | 2276.7013 | 17.81 |
| 30 | Central | Iowa | 12426.1470 | 2258.5883 | 18.18 |
| 31 | East | New Hampshire | 9720.1460 | 1519.1696 | 15.63 |
| 32 | Central | Nebraska | 6492.4100 | 1166.0176 | 17.96 |
| 33 | West | New Mexico | 6046.1880 | 1340.1399 | 22.17 |
| 34 | Central | Oklahoma | 5135.8180 | 829.0182 | 16.14 |
| 35 | South | Arkansas | 4582.5560 | -62.9462 | -1.37 |
| 36 | Central | South Dakota | 2339.5980 | 682.5542 | 29.17 |
| 37 | East | District of Columbia | 2198.4500 | 490.9567 | 22.33 |
| 38 | Central | Kansas | 1727.6520 | 139.2008 | 8.06 |
| 39 | East | Maryland | 1588.8100 | 436.6492 | 27.48 |
| 40 | West | Nevada | 1214.9860 | 278.0678 | 22.89 |
California is the strongest-performing state among the displayed results, generating approximately 451,037 in sales and 59,398 in profit. New York also performs well, recording approximately 279,550 in sales and 58,178 in profit, with a profit margin of 20.81%. Washington achieves a relatively high profit margin of 18.33%.
However, regional performance is not uniformly positive. North Carolina generates approximately 116,635 in sales but records a loss of around 4,237, resulting in a negative profit margin of 3.63%. This indicates that certain markets may experience profitability challenges despite generating substantial sales.
Question 6
How do repeat customers contribute to overall sales?
%%sql
WITH customer_orders AS (
    SELECT
        customer_id,
        COUNT(DISTINCT order_id) AS total_orders,
        SUM(sales) AS total_sales,
        SUM(profit) AS total_profit
    FROM orders
    GROUP BY customer_id
),
customer_groups AS (
    SELECT
        CASE
            WHEN total_orders > 1 THEN 'Repeat customer'
            ELSE 'One-time customer'
        END AS customer_type,
        customer_id,
        total_orders,
        total_sales,
        total_profit
    FROM customer_orders
)
SELECT
    customer_type,
    COUNT(*) AS total_customers,
    SUM(total_orders) AS total_orders,
    SUM(total_sales) AS total_sales,
    SUM(total_profit) AS total_profit,
    ROUND(AVG(total_sales), 2) AS avg_sales_per_customer
FROM customer_groups
GROUP BY customer_type
ORDER BY total_sales DESC;
Running query in 'postgresql://postgres:***@localhost:5432/sql_projects_db'
2 rows affected.
| customer_type | total_customers | total_orders | total_sales | total_profit | avg_sales_per_customer | |
|---|---|---|---|---|---|---|
| 0 | Repeat customer | 781 | 4997 | 2292033.2203 | 285629.6471 | 2934.74 |
| 1 | One-time customer | 12 | 12 | 5167.6400 | 767.3746 | 430.64 |
Repeat customers contribute approximately 2.29 million in sales and 285,630 in profit, compared with approximately 5,168 in sales and 767 in profit from one-time customers. The repeat-customer group also accounts for 4,997 orders, compared with only 12 orders from one-time customers.
The results indicate that repeat customers represent the dominant source of sales and profit in this dataset. Their average sales per customer are approximately 2,934.74, substantially higher than the 430.64 recorded for one-time customers.
Question 7
How does shipping mode relate to delivery time and profitability?
%%sql
SELECT
    ship_mode,
    COUNT(DISTINCT order_id) AS total_orders,
    ROUND(
        AVG(ship_date - order_date),
        2
    ) AS avg_shipping_days,
    SUM(sales) AS total_sales,
    SUM(profit) AS total_profit
FROM orders
GROUP BY ship_mode
ORDER BY avg_shipping_days;
Running query in 'postgresql://postgres:***@localhost:5432/sql_projects_db'
4 rows affected.
| ship_mode | total_orders | avg_shipping_days | total_sales | total_profit | |
|---|---|---|---|---|---|
| 0 | Same Day | 264 | 0.04 | 128363.1250 | 15891.7589 |
| 1 | First Class | 787 | 2.18 | 351428.4229 | 48969.8399 |
| 2 | Second Class | 964 | 3.24 | 459193.5694 | 57446.6354 |
| 3 | Standard Class | 2994 | 5.01 | 1358215.7430 | 164088.7875 |
Standard Class accounts for the largest number of orders, with 2,994 orders, and generates approximately 1.36 million in sales and 164,089 in profit. Its average shipping duration is approximately 5.01 days. Second Class records an average shipping duration of 3.24 days, while First Class averages 2.18 days, same Day has the shortest average duration.
First Class, Second Class, and Standard Class all generate positive total profits. Standard Class contributes the highest absolute profit, largely alongside its much larger order volume. These figures alone do not establish which shipping mode is the most profitable per order because the analysis does not compare profit margins or control for differences in order characteristics.
Conclusions
This exploratory data analysis reveals several important patterns in the company’s sales performance, product profitability, customer behavior, and shipping operations.
First, monthly sales fluctuate considerably over time, although an overall increase is visible toward the end of the observed period. Product-level analysis shows that strong sales do not necessarily translate into positive profit, with Tables, Bookcases, and Supplies emerging as examples of sub-categories that require further investigation. Discount analysis also reveals a strong negative association between higher discount levels and profitability, highlighting the importance of evaluating promotional strategies carefully.
Second, the Consumer segment contributes the largest total sales and profit, while Home Office records the highest average sales per order among the three customer segments. Geographically, California and New York perform strongly in both sales and profit, whereas North Carolina records negative profitability among the displayed states. Repeat customers account for the overwhelming majority of sales and profit, emphasizing the potential importance of customer retention.
Finally, Standard Class accounts for the largest share of orders and the highest absolute profit among the shipping modes examined. Nevertheless, additional cost and margin analysis is needed to assess shipping efficiency more comprehensively.
Overall, the findings suggest that the company could improve its performance by reviewing high-discount transactions, addressing loss-making product sub-categories, strengthening customer retention, and investigating regional profitability differences. These results are descriptive and identify areas for further investigation rather than establishing causal relationships. Additional analyses incorporating shipping costs, product-level discount effects, customer purchasing patterns, and seasonal trends would provide a more comprehensive basis for business decisions.