%pip install --upgrade -q jupysql psycopg2-binary python-dotenv sqlalchemyNetflix Subscription
Data Analysis
SQL
Overview
This project explores the netflix subscription datasets using SQL to answer key analytical questions and uncover meaningful patterns in the data.
Queries are executed directly from a Jupyter Notebook using PostgreSQL, JupySQL, and SQLAlchemy.
Tools & Technologies
PostgreSQL
SQL
Jupyter Notebook
JupySQL
SQLAlchemy
Analysis Workflow
Preprocess the dataset and understand its structure.
Create the table schema and insert the data into the table.
Formulate analytical questions.
Query and manipulate data using SQL.
Interpret query results and summarize key findings.
Install Packages
%config SqlMagic.autopandas = True
%config SqlMagic.displaylimit = 50
Connect to The Database
import os
from dotenv import load_dotenv, find_dotenv

load_dotenv(find_dotenv())

# get credentials from .env
db_user = os.getenv("DB_USER")
db_password = os.getenv("DB_PASSWORD")
db_host = os.getenv("DB_HOST")
db_port = os.getenv("DB_PORT")
db_name = os.getenv("DB_NAME")

connection_string = f"postgresql://{db_user}:{db_password}@{db_host}:{db_port}/{db_name}"
os.environ['DATABASE_URL'] = connection_string%load_ext sql%sqlPrepare the Data
import pandas as pd

titles_df = pd.read_excel('data/netflix_titles.xlsx')
userbase_df = pd.read_excel('data/netflix_userbase.xlsx')titles_df| user_id | type | title | director | date_added | release_year | rating | duration | listed_in | |
|---|---|---|---|---|---|---|---|---|---|
| 0 | 560 | Movie | Dick Johnson Is Dead | Kirsten Johnson | 2021-09-25 00:00:00 | 2020 | PG-13 | 90 min | Documentaries |
| 1 | 312 | TV Show | Blood & Water | NaN | 2021-09-24 00:00:00 | 2021 | TV-MA | 2 Seasons | International TV Shows |
| 2 | 469 | TV Show | Ganglands | Julien Leclercq | 2021-09-24 00:00:00 | 2021 | TV-MA | 1 Season | Crime TV Shows |
| 3 | 337 | TV Show | Jailbirds New Orleans | NaN | 2021-09-24 00:00:00 | 2021 | TV-MA | 1 Season | Docuseries |
| 4 | 655 | TV Show | Kota Factory | NaN | 2021-09-24 00:00:00 | 2021 | TV-MA | 2 Seasons | International TV Shows |
| ... | ... | ... | ... | ... | ... | ... | ... | ... | ... |
| 8802 | 785 | Movie | Zodiac | David Fincher | 2019-11-20 00:00:00 | 2007 | R | 158 min | Cult Movies |
| 8803 | 804 | TV Show | Zombie Dumb | NaN | July 1, 2019 | 2018 | TV-Y7 | 2 Seasons | Kids' TV |
| 8804 | 32 | Movie | Zombieland | Ruben Fleischer | 2019-11-01 00:00:00 | 2009 | R | 88 min | Comedies |
| 8805 | 222 | Movie | Zoom | Peter Hewitt | January 11, 2020 | 2006 | PG | 88 min | Children & Family Movies |
| 8806 | 118 | Movie | Zubaan | Mozez Singh | March 2, 2019 | 2015 | TV-14 | 111 min | Dramas |
8807 rows × 9 columns
userbase_df| id_user | subscription_type | monthly_revenue | join_date | last_payment_date | country | age | gender | device | plan_duration | |
|---|---|---|---|---|---|---|---|---|---|---|
| 0 | 1 | Basic | 10 | 2022-01-15 | 2023-06-10 | United States | 28 | Male | Smartphone | 1 |
| 1 | 2 | Premium | 15 | 2021-09-05 | 2023-06-22 | Canada | 35 | Female | Tablet | 1 |
| 2 | 3 | Standard | 12 | 2023-02-28 | 2023-06-27 | United Kingdom | 42 | Male | Smart TV | 1 |
| 3 | 4 | Standard | 12 | 2022-07-10 | 2023-06-26 | Australia | 51 | Female | Laptop | 1 |
| 4 | 5 | Basic | 10 | 2023-05-01 | 2023-06-28 | Germany | 33 | Male | Smartphone | 1 |
| ... | ... | ... | ... | ... | ... | ... | ... | ... | ... | ... |
| 1017 | 1018 | Standard | 13 | 2022-06-26 | 2023-07-02 | United Kingdom | 35 | Female | Tablet | 1 |
| 1018 | 1019 | Standard | 14 | 2022-06-24 | 2023-06-30 | Australia | 27 | Female | Tablet | 1 |
| 1019 | 1020 | Basic | 13 | 2022-06-21 | 2023-07-01 | Germany | 38 | Male | Tablet | 1 |
| 1020 | 1021 | Premium | 13 | 2022-06-22 | 2023-07-03 | France | 33 | Male | Smart TV | 1 |
| 1021 | 1022 | Basic | 11 | 2022-06-18 | 2023-07-02 | Brazil | 48 | Male | Laptop | 1 |
1022 rows × 10 columns
titles_df.info()<class 'pandas.DataFrame'>
RangeIndex: 8807 entries, 0 to 8806
Data columns (total 9 columns):
# Column Non-Null Count Dtype
--- ------ -------------- -----
0 user_id 8807 non-null int64
1 type 8807 non-null str
2 title 8807 non-null object
3 director 6173 non-null str
4 date_added 8797 non-null object
5 release_year 8807 non-null int64
6 rating 8803 non-null str
7 duration 8804 non-null str
8 listed_in 8807 non-null str
dtypes: int64(2), object(2), str(5)
memory usage: 619.4+ KBuserbase_df.info()<class 'pandas.DataFrame'>
RangeIndex: 1022 entries, 0 to 1021
Data columns (total 10 columns):
# Column Non-Null Count Dtype
--- ------ -------------- -----
0 id_user 1022 non-null int64
1 subscription_type 1022 non-null str
2 monthly_revenue 1022 non-null int64
3 join_date 1022 non-null datetime64[us]
4 last_payment_date 1022 non-null datetime64[us]
5 country 1022 non-null str
6 age 1022 non-null int64
7 gender 1022 non-null str
8 device 1022 non-null str
9 plan_duration 1022 non-null int64
dtypes: datetime64[us](2), int64(4), str(4)
memory usage: 80.0 KBtitles_df['director'] = titles_df['director'].fillna('Not Registered')
titles_df['date_added'] = titles_df['date_added'].fillna(titles_df['release_year'].astype(str) + '-01-01')titles_df['date_added'] = pd.to_datetime(titles_df['date_added'], format='mixed', errors='coerce')
titles_df['date_added'] = titles_df['date_added'].dt.strftime('%Y-%m-%d')userbase_df = userbase_df.rename(columns={'id_user': 'user_id'})titles_df| user_id | type | title | director | date_added | release_year | rating | duration | listed_in | |
|---|---|---|---|---|---|---|---|---|---|
| 0 | 560 | Movie | Dick Johnson Is Dead | Kirsten Johnson | 2021-09-25 | 2020 | PG-13 | 90 min | Documentaries |
| 1 | 312 | TV Show | Blood & Water | Not Registered | 2021-09-24 | 2021 | TV-MA | 2 Seasons | International TV Shows |
| 2 | 469 | TV Show | Ganglands | Julien Leclercq | 2021-09-24 | 2021 | TV-MA | 1 Season | Crime TV Shows |
| 3 | 337 | TV Show | Jailbirds New Orleans | Not Registered | 2021-09-24 | 2021 | TV-MA | 1 Season | Docuseries |
| 4 | 655 | TV Show | Kota Factory | Not Registered | 2021-09-24 | 2021 | TV-MA | 2 Seasons | International TV Shows |
| ... | ... | ... | ... | ... | ... | ... | ... | ... | ... |
| 8802 | 785 | Movie | Zodiac | David Fincher | 2019-11-20 | 2007 | R | 158 min | Cult Movies |
| 8803 | 804 | TV Show | Zombie Dumb | Not Registered | 2019-07-01 | 2018 | TV-Y7 | 2 Seasons | Kids' TV |
| 8804 | 32 | Movie | Zombieland | Ruben Fleischer | 2019-11-01 | 2009 | R | 88 min | Comedies |
| 8805 | 222 | Movie | Zoom | Peter Hewitt | 2020-01-11 | 2006 | PG | 88 min | Children & Family Movies |
| 8806 | 118 | Movie | Zubaan | Mozez Singh | 2019-03-02 | 2015 | TV-14 | 111 min | Dramas |
8807 rows × 9 columns
titles_df.info()<class 'pandas.DataFrame'>
RangeIndex: 8807 entries, 0 to 8806
Data columns (total 9 columns):
# Column Non-Null Count Dtype
--- ------ -------------- -----
0 user_id 8807 non-null int64
1 type 8807 non-null str
2 title 8807 non-null object
3 director 8807 non-null str
4 date_added 8807 non-null str
5 release_year 8807 non-null int64
6 rating 8803 non-null str
7 duration 8804 non-null str
8 listed_in 8807 non-null str
dtypes: int64(2), object(1), str(6)
memory usage: 619.4+ KBtitles_df['title'].nunique()8807titles_df['title'].str.len().max()np.float64(104.0)titles_df['director'].str.len().max()np.int64(208)userbase_df.head()| user_id | subscription_type | monthly_revenue | join_date | last_payment_date | country | age | gender | device | plan_duration | |
|---|---|---|---|---|---|---|---|---|---|---|
| 0 | 1 | Basic | 10 | 2022-01-15 | 2023-06-10 | United States | 28 | Male | Smartphone | 1 |
| 1 | 2 | Premium | 15 | 2021-09-05 | 2023-06-22 | Canada | 35 | Female | Tablet | 1 |
| 2 | 3 | Standard | 12 | 2023-02-28 | 2023-06-27 | United Kingdom | 42 | Male | Smart TV | 1 |
| 3 | 4 | Standard | 12 | 2022-07-10 | 2023-06-26 | Australia | 51 | Female | Laptop | 1 |
| 4 | 5 | Basic | 10 | 2023-05-01 | 2023-06-28 | Germany | 33 | Male | Smartphone | 1 |
userbase_df.info()<class 'pandas.DataFrame'>
RangeIndex: 1022 entries, 0 to 1021
Data columns (total 10 columns):
# Column Non-Null Count Dtype
--- ------ -------------- -----
0 user_id 1022 non-null int64
1 subscription_type 1022 non-null str
2 monthly_revenue 1022 non-null int64
3 join_date 1022 non-null datetime64[us]
4 last_payment_date 1022 non-null datetime64[us]
5 country 1022 non-null str
6 age 1022 non-null int64
7 gender 1022 non-null str
8 device 1022 non-null str
9 plan_duration 1022 non-null int64
dtypes: datetime64[us](2), int64(4), str(4)
memory usage: 80.0 KBCreate the Table Schema
%%sql
-- userbase table
CREATE TABLE IF NOT EXISTS userbase (
    user_id INT PRIMARY KEY,
    subscription_type VARCHAR(15),
    monthly_revenue INT,
    join_date DATE,
    last_payment_date DATE,
    country VARCHAR(25),
    age INT,
    gender VARCHAR(10),
    device VARCHAR(20),
    plan_duration INT
);

-- titles table
CREATE TABLE IF NOT EXISTS titles (
    user_id INT REFERENCES userbase(user_id),
    type VARCHAR(20),
    title VARCHAR(150) PRIMARY KEY,
    director VARCHAR(250),
    date_added DATE,
    release_year INT,
    rating VARCHAR(10),
    duration VARCHAR(20),
    listed_in VARCHAR(100)
);
Running query in 'postgresql://postgres:***@localhost:5432/sql_projects_db'
Insert The Data Into The Table
def insert_new_data(df, table_name, engine, key_cols):
    '''Insert only new data from DataFrame to the table in the SQL database.

    :param df: pandas DataFrame.
    :param table_name: a string of table name destination in the SQL database.
    :param engine: SQLAlchemy engine connection object.
    :param key_cols: string or list of primary key/composite keys
    '''

    if df.empty:
        print("DataFrame is empty.")
        return

    # make the key_cols is always a list
    if isinstance(key_cols, str):
        keys = [key_cols]
    else:
        keys = key_cols

    cols_str = ", ".join(keys)
    query = f"SELECT {cols_str} FROM {table_name}"
    existing_df = pd.read_sql(query, con=engine)


    if len(keys) == 1:
        # only 1 primary key
        key_col = keys[0]
        existing_keys = existing_df[key_col].tolist()
        new_df = df[~df[key_col].isin(existing_keys)].copy()
    else:
        # composite key
        merged = df.merge(existing_df[keys].drop_duplicates(), on=keys, how="left", indicator=True)
        new_df = merged[merged["_merge"] == "left_only"].drop(columns=["_merge"]).copy()

    if not new_df.empty:
        new_df.to_sql(table_name, con=engine, if_exists="append", index=False)
        print(f"Successfully inserted {len(new_df)} new rows of data into the table '{table_name}'.")
    else:
        print(f"All datas have been saved to the table '{table_name}'.")
from sqlalchemy import create_engine
engine = create_engine(connection_string)
# insert userbase data
insert_new_data(df=userbase_df, table_name='userbase', engine=engine, key_cols='user_id')
# insert titles data
insert_new_data(df=titles_df, table_name='titles', engine=engine, key_cols='title')Successfully inserted 1022 new rows of data into the table 'userbase'.
Successfully inserted 8807 new rows of data into the table 'titles'.%%sql
SELECT *
FROM userbase
LIMIT 5;
Running query in 'postgresql://postgres:***@localhost:5432/sql_projects_db'
5 rows affected.
| user_id | subscription_type | monthly_revenue | join_date | last_payment_date | country | age | gender | device | plan_duration |
|---|---|---|---|---|---|---|---|---|---|
| 1 | Basic | 10 | 2022-01-15 | 2023-06-10 | United States | 28 | Male | Smartphone | 1 |
| 2 | Premium | 15 | 2021-09-05 | 2023-06-22 | Canada | 35 | Female | Tablet | 1 |
| 3 | Standard | 12 | 2023-02-28 | 2023-06-27 | United Kingdom | 42 | Male | Smart TV | 1 |
| 4 | Standard | 12 | 2022-07-10 | 2023-06-26 | Australia | 51 | Female | Laptop | 1 |
| 5 | Basic | 10 | 2023-05-01 | 2023-06-28 | Germany | 33 | Male | Smartphone | 1 |
%%sql
SELECT *
FROM titles
LIMIT 5;
Running query in 'postgresql://postgres:***@localhost:5432/sql_projects_db'
5 rows affected.
| user_id | type | title | director | date_added | release_year | rating | duration | listed_in |
|---|---|---|---|---|---|---|---|---|
| 560 | Movie | Dick Johnson Is Dead | Kirsten Johnson | 2021-09-25 | 2020 | PG-13 | 90 min | Documentaries |
| 312 | TV Show | Blood & Water | Not Registered | 2021-09-24 | 2021 | TV-MA | 2 Seasons | International TV Shows |
| 469 | TV Show | Ganglands | Julien Leclercq | 2021-09-24 | 2021 | TV-MA | 1 Season | Crime TV Shows |
| 337 | TV Show | Jailbirds New Orleans | Not Registered | 2021-09-24 | 2021 | TV-MA | 1 Season | Docuseries |
| 655 | TV Show | Kota Factory | Not Registered | 2021-09-24 | 2021 | TV-MA | 2 Seasons | International TV Shows |
Business Questions
Question 1
Which subscription plans contribute the most to total revenue?
%%sql
SELECT
    subscription_type,
    SUM(monthly_revenue) AS total_monthly_revenue,
    COUNT(*) AS total_users,
    ROUND(AVG(monthly_revenue), 2) AS avg_monthly_revenue_per_user
FROM userbase
GROUP BY subscription_type
ORDER BY total_monthly_revenue DESC;
Running query in 'postgresql://postgres:***@localhost:5432/sql_projects_db'
3 rows affected.
| subscription_type | total_monthly_revenue | total_users | avg_monthly_revenue_per_user | |
|---|---|---|---|---|
| 0 | Basic | 5048 | 408 | 12.37 |
| 1 | Standard | 3929 | 314 | 12.51 |
| 2 | Premium | 3800 | 300 | 12.67 |
Key Insight
The Basic subscription plan generates the highest total monthly revenue, primarily due to its larger subscriber base. In contrast, Premium has the highest average monthly revenue per user. This suggests that total revenue is more strongly differentiated by subscriber volume than by the average revenue per user in this dataset.
Question 2
Which countries generate the highest revenue, and does subscriber volume explain the difference?
%%sql
WITH country_metrics AS (
    SELECT
        country,
        COUNT(*) AS total_subscribers,
        SUM(monthly_revenue) AS total_monthly_revenue,
        ROUND(AVG(monthly_revenue), 2) AS avg_revenue_per_user
    FROM userbase
    GROUP BY country
)
SELECT
    country,
    total_subscribers,
    total_monthly_revenue,
    avg_revenue_per_user,
    ROUND(
        100.0 * total_monthly_revenue
        / NULLIF(SUM(total_monthly_revenue) OVER (), 0), -- use NULLIFF to avoid division by zero
        2
    ) AS revenue_contribution_pct
FROM country_metrics
ORDER BY total_monthly_revenue DESC;
Running query in 'postgresql://postgres:***@localhost:5432/sql_projects_db'
10 rows affected.
| country | total_subscribers | total_monthly_revenue | avg_revenue_per_user | revenue_contribution_pct | |
|---|---|---|---|---|---|
| 0 | Spain | 154 | 1966 | 12.77 | 15.39 |
| 1 | United States | 155 | 1928 | 12.44 | 15.09 |
| 2 | Canada | 120 | 1467 | 12.23 | 11.48 |
| 3 | Brazil | 85 | 1078 | 12.68 | 8.44 |
| 4 | France | 85 | 1074 | 12.64 | 8.41 |
| 5 | United Kingdom | 85 | 1064 | 12.52 | 8.33 |
| 6 | Australia | 85 | 1061 | 12.48 | 8.30 |
| 7 | Italy | 84 | 1054 | 12.55 | 8.25 |
| 8 | Germany | 85 | 1049 | 12.34 | 8.21 |
| 9 | Mexico | 84 | 1036 | 12.33 | 8.11 |
Key Insight
Spain contributes the largest share of total monthly revenue (15.39%), slightly exceeding the United States (15.09%) despite having one fewer subscriber. This difference is consistent with Spain’s higher average revenue per user. The results illustrate how both subscriber volume and average revenue per user contribute to differences in revenue across countries.
Question 3
How has subscriber acquisition changed over time?
%%sql
WITH monthly_signups AS (
    SELECT
        DATE_TRUNC('month', join_date)::date AS signup_month,
        COUNT(*) AS new_subscribers
    FROM userbase
    GROUP BY DATE_TRUNC('month', join_date)::date
),
signup_trends AS (
    SELECT
        signup_month,
        new_subscribers,
        LAG(new_subscribers) OVER (
            ORDER BY signup_month
        ) AS previous_month_signups
    FROM monthly_signups
)
SELECT
    signup_month,
    new_subscribers,
    previous_month_signups,
    new_subscribers - previous_month_signups AS signup_change,
    ROUND(
        100.0 * (new_subscribers - previous_month_signups)
        / NULLIF(previous_month_signups, 0),
        2
    ) AS growth_pct
FROM signup_trends
ORDER BY signup_month;
Running query in 'postgresql://postgres:***@localhost:5432/sql_projects_db'
22 rows affected.
| signup_month | new_subscribers | previous_month_signups | signup_change | growth_pct | |
|---|---|---|---|---|---|
| 0 | 2021-09-01 | 3 | NaN | NaN | None |
| 1 | 2021-10-01 | 3 | 3.0 | 0.0 | 0.00 |
| 2 | 2021-11-01 | 4 | 3.0 | 1.0 | 33.33 |
| 3 | 2021-12-01 | 4 | 4.0 | 0.0 | 0.00 |
| 4 | 2022-01-01 | 8 | 4.0 | 4.0 | 100.00 |
| 5 | 2022-02-01 | 5 | 8.0 | -3.0 | -37.50 |
| 6 | 2022-03-01 | 13 | 5.0 | 8.0 | 160.00 |
| 7 | 2022-04-01 | 19 | 13.0 | 6.0 | 46.15 |
| 8 | 2022-05-01 | 40 | 19.0 | 21.0 | 110.53 |
| 9 | 2022-06-01 | 185 | 40.0 | 145.0 | 362.50 |
| 10 | 2022-07-01 | 129 | 185.0 | -56.0 | -30.27 |
| 11 | 2022-08-01 | 152 | 129.0 | 23.0 | 17.83 |
| 12 | 2022-09-01 | 128 | 152.0 | -24.0 | -15.79 |
| 13 | 2022-10-01 | 174 | 128.0 | 46.0 | 35.94 |
| 14 | 2022-11-01 | 95 | 174.0 | -79.0 | -45.40 |
| 15 | 2022-12-01 | 22 | 95.0 | -73.0 | -76.84 |
| 16 | 2023-01-01 | 12 | 22.0 | -10.0 | -45.45 |
| 17 | 2023-02-01 | 7 | 12.0 | -5.0 | -41.67 |
| 18 | 2023-03-01 | 6 | 7.0 | -1.0 | -14.29 |
| 19 | 2023-04-01 | 5 | 6.0 | -1.0 | -16.67 |
| 20 | 2023-05-01 | 5 | 5.0 | 0.0 | 0.00 |
| 21 | 2023-06-01 | 3 | 5.0 | -2.0 | -40.00 |
%%sql subscription_growth_trends <<
WITH monthly_signups AS (
    SELECT
        DATE_TRUNC('month', join_date)::date AS signup_month,
        COUNT(*) AS new_subscribers
    FROM userbase
    GROUP BY DATE_TRUNC('month', join_date)::date
),
signup_trends AS (
    SELECT
        signup_month,
        new_subscribers,
        LAG(new_subscribers) OVER (
            ORDER BY signup_month
        ) AS previous_month_signups
    FROM monthly_signups
)
SELECT
    signup_month,
    new_subscribers,
    previous_month_signups,
    new_subscribers - previous_month_signups AS signup_change,
    ROUND(
        100.0 * (new_subscribers - previous_month_signups)
        / NULLIF(previous_month_signups, 0),
        2
    ) AS growth_pct
FROM signup_trends
ORDER BY signup_month;
Running query in 'postgresql://postgres:***@localhost:5432/sql_projects_db'
22 rows affected.
import matplotlib.pyplot as plt

plt.plot(subscription_growth_trends['signup_month'], subscription_growth_trends['new_subscribers'])
plt.title('Monthly New Subscribers Over Time')
plt.xlabel('Month')
plt.ylabel('Number of New Subscribers')
plt.show()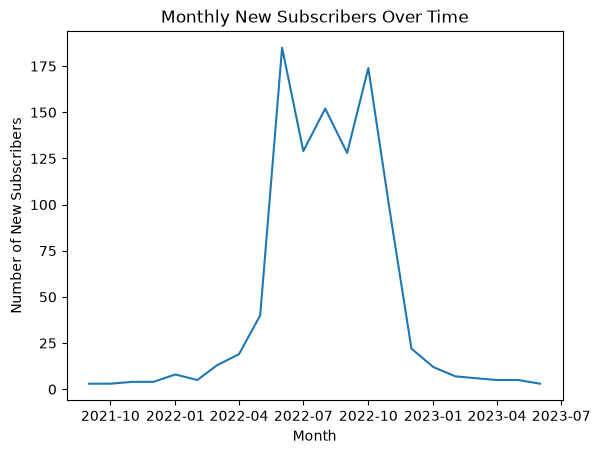
Key Insight
Monthly subscriber acquisition increased substantially during the first half of 2022, reaching a peak of 185 new subscribers in June. This was followed by a general decline in new signups through the remainder of 2022 and into the first half of 2023. The sharp fluctuations suggest that subscriber acquisition was highly uneven over the observed period, although the dataset alone cannot explain the underlying causes.
Question 4
How does subscription preference vary across age groups?
%%sql
WITH age_groups AS (
    SELECT
        CASE
            WHEN age < 30 THEN 'Under 30'
            WHEN age < 40 THEN '30-39'
            WHEN age < 50 THEN '40-49'
            ELSE '50 and above'
        END AS age_group,
        subscription_type
    FROM userbase
)
SELECT
    age_group,
    subscription_type,
    COUNT(*) AS total_subscribers,
    ROUND(
        100.0 * COUNT(*)
        / SUM(COUNT(*)) OVER (PARTITION BY age_group),
        2
    ) AS pct_within_age_group
FROM age_groups
GROUP BY age_group, subscription_type
ORDER BY
    CASE age_group
        WHEN 'Under 30' THEN 1
        WHEN '30-39' THEN 2
        WHEN '40-49' THEN 3
        WHEN '50 and above' THEN 4
    END,
    total_subscribers DESC;
Running query in 'postgresql://postgres:***@localhost:5432/sql_projects_db'
12 rows affected.
| age_group | subscription_type | total_subscribers | pct_within_age_group | |
|---|---|---|---|---|
| 0 | Under 30 | Basic | 50 | 37.04 |
| 1 | Under 30 | Premium | 45 | 33.33 |
| 2 | Under 30 | Standard | 40 | 29.63 |
| 3 | 30-39 | Basic | 174 | 41.04 |
| 4 | 30-39 | Standard | 131 | 30.90 |
| 5 | 30-39 | Premium | 119 | 28.07 |
| 6 | 40-49 | Basic | 161 | 40.76 |
| 7 | 40-49 | Standard | 118 | 29.87 |
| 8 | 40-49 | Premium | 116 | 29.37 |
| 9 | 50 and above | Standard | 25 | 36.76 |
| 10 | 50 and above | Basic | 23 | 33.82 |
| 11 | 50 and above | Premium | 20 | 29.41 |
Key Insight
The Basic plan is the most common subscription type among users under 50, accounting for approximately 37–41% of subscribers in these age groups. Among users aged 50 and above, Standard becomes the most common plan. However, the differences between subscription types are relatively modest, suggesting that no single plan overwhelmingly dominates any age group.
Question 5
What type of show do users watch most frequently??
%%sql
SELECT
    type AS content_type,
    COUNT(*) AS total_titles,
    ROUND(
        100.0 * COUNT(*) / SUM(COUNT(*)) OVER (),
        2
    ) AS catalog_share_pct
FROM titles
GROUP BY type
ORDER BY total_titles DESC;
Running query in 'postgresql://postgres:***@localhost:5432/sql_projects_db'
2 rows affected.
| content_type | total_titles | catalog_share_pct | |
|---|---|---|---|
| 0 | Movie | 6131 | 69.62 |
| 1 | TV Show | 2676 | 30.38 |
Key Insight
Movies account for 69.62% of the content catalog, substantially exceeding TV Shows at 30.38%. The catalog therefore contains more than twice as many movies as TV Shows, indicating a stronger representation of movie titles in the dataset.
Question 6
Which genre is most popular among users?
%%sql
SELECT
    listed_in AS content_genre,
    COUNT(*) AS total_titles,
    ROUND(
        100.0 * COUNT(*) / SUM(COUNT(*)) OVER (),
        2
    ) AS catalog_share_pct
FROM titles
GROUP BY listed_in
ORDER BY total_titles DESC;
Running query in 'postgresql://postgres:***@localhost:5432/sql_projects_db'
36 rows affected.
| content_genre | total_titles | catalog_share_pct | |
|---|---|---|---|
| 0 | Dramas | 1600 | 18.17 |
| 1 | Comedies | 1210 | 13.74 |
| 2 | Action & Adventure | 859 | 9.75 |
| 3 | Documentaries | 829 | 9.41 |
| 4 | International TV Shows | 774 | 8.79 |
| 5 | Children & Family Movies | 605 | 6.87 |
| 6 | Crime TV Shows | 399 | 4.53 |
| 7 | Kids' TV | 388 | 4.41 |
| 8 | Stand-Up Comedy | 334 | 3.79 |
| 9 | Horror Movies | 275 | 3.12 |
| 10 | British TV Shows | 253 | 2.87 |
| 11 | Docuseries | 221 | 2.51 |
| 12 | Anime Series | 176 | 2.00 |
| 13 | International Movies | 128 | 1.45 |
| 14 | TV Comedies | 120 | 1.36 |
| 15 | Reality TV | 120 | 1.36 |
| 16 | Classic Movies | 80 | 0.91 |
| 17 | TV Dramas | 67 | 0.76 |
| 18 | Thrillers | 65 | 0.74 |
| 19 | Movies | 57 | 0.65 |
| 20 | TV Action & Adventure | 40 | 0.45 |
| 21 | Stand-Up Comedy & Talk Shows | 34 | 0.39 |
| 22 | Romantic TV Shows | 32 | 0.36 |
| 23 | Classic & Cult TV | 22 | 0.25 |
| 24 | Anime Features | 21 | 0.24 |
| 25 | Independent Movies | 20 | 0.23 |
| 26 | Music & Musicals | 18 | 0.20 |
| 27 | TV Shows | 16 | 0.18 |
| 28 | Sci-Fi & Fantasy | 13 | 0.15 |
| 29 | Cult Movies | 12 | 0.14 |
| 30 | TV Horror | 11 | 0.12 |
| 31 | Romantic Movies | 3 | 0.03 |
| 32 | Spanish-Language TV Shows | 2 | 0.02 |
| 33 | Sports Movies | 1 | 0.01 |
| 34 | LGBTQ Movies | 1 | 0.01 |
| 35 | TV Sci-Fi & Fantasy | 1 | 0.01 |
Key Insight
Dramas is the most represented genre in the catalog, accounting for 18.17% of all titles, followed by Comedies at 13.74%. Action & Adventure and Documentaries are also prominent categories. Since titles can belong to multiple genres, these percentages are not mutually exclusive and should not be expected to sum to 100%.
Question 7
What devices do users use most often?
%%sql
SELECT
    device,
    COUNT(*) AS total_users,
    ROUND(
        100.0 * COUNT(*) / SUM(COUNT(*)) OVER (),
        2
    ) AS device_share_pct
FROM userbase
GROUP BY device
ORDER BY total_users DESC;
Running query in 'postgresql://postgres:***@localhost:5432/sql_projects_db'
4 rows affected.
| device | total_users | device_share_pct | |
|---|---|---|---|
| 0 | Laptop | 277 | 27.10 |
| 1 | Smartphone | 265 | 25.93 |
| 2 | Smart TV | 240 | 23.48 |
| 3 | Tablet | 240 | 23.48 |
Key Insight
Laptop is the most commonly recorded device, accounting for 27.10% of users, followed closely by smartphones at 25.93%. Smart TVs and tablets each account for 23.48%. The relatively balanced distribution suggests that no single device category dominates the recorded user base.
Conclusion
This exploratory SQL analysis examined subscription revenue, subscriber characteristics, device distribution, content composition, and genre representation within the dataset.
The main findings are:
Subscription revenue: The Basic plan generated the highest total monthly revenue (5,048), supported by its larger subscriber base. Premium recorded the highest average monthly revenue per user (12.67).
Geographic revenue distribution: Spain contributed the largest share of monthly revenue (15.39%), slightly exceeding the United States (15.09%). Differences in both subscriber volume and average revenue per user contributed to the observed variation.
Subscriber acquisition: New signups peaked at 185 in June 2022 before declining substantially over the following months. The observed fluctuations warrant further investigation, but the available data does not establish their causes.
Content composition: Movies accounted for 69.62% of the catalog, while TV Shows represented 30.38%. Dramas and Comedies were the most represented genres, accounting for 18.17% and 13.74% of the catalog, respectively.
Device distribution: Laptop was the most commonly recorded device (27.10%), followed by smartphones (25.93%). The relatively small differences across device categories indicate a broadly distributed user base in terms of recorded device type.
Overall, the analysis demonstrates how SQL can be used to aggregate data, compare segments, examine temporal patterns, and derive descriptive insights from structured datasets.
Limitations
The findings are descriptive and limited to the available dataset. The analysis does not establish causal relationships, explain the underlying reasons for observed trends, or measure customer retention and content popularity. Further analysis would require additional data, such as subscription history, viewing activity, and more detailed temporal records.